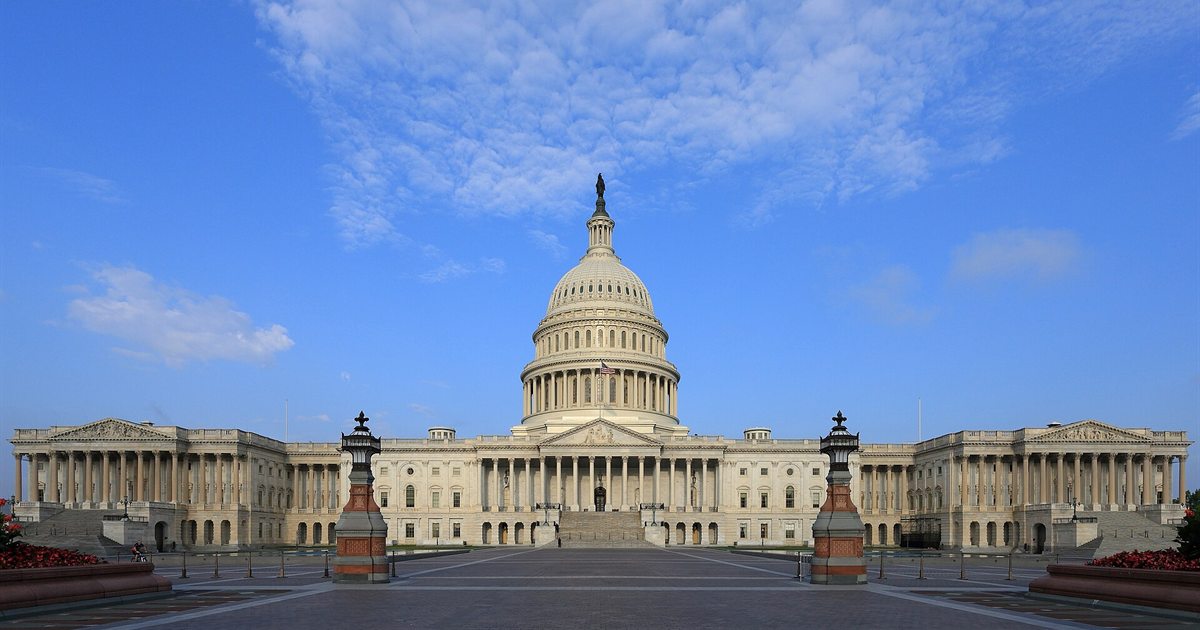
Photo: Martin Falbisoner / Wikimedia Commons, CC BY-SA 3.0, cropped
Midterm Elections and the Stock Market: What 70 Years of History Says About Investing Around November 3, 2026
Midterm elections are held halfway through a US president's four-year term; the next is on November 3, 2026. Historically, midterm years have been the bumpiest of the four-year presidential cycle: since 1950 the S&P 500 has averaged a peak-to-trough drop of about 17% during midterm years, compared with roughly 11-13% in other years. But the 12 months after a midterm have been positive in every cycle since the early 1950s, with average gains of about 15%, depending on how it's measured. The usual explanation is that uncertainty peaks before the vote and fades after it, and that divided government tends to mean fewer surprise policy changes. Past patterns don't guarantee future results, and 2026 has unusual risks: high valuations, an oil shock and rising interest rates. For long-term investors, the best response to an election is usually to stick to the plan.
What are midterm elections?
Midterm elections happen halfway through a US president's four-year term. Voters choose all 435 members of the House of Representatives, about a third of the Senate, and many governors and state officials. The president isn't on the ballot, but the result decides whether the president's party keeps control of Congress.
The 2026 midterms are on Tuesday, November 3.
The midterm pattern in the stock market
Market historians often talk about the four-year presidential cycle. Each year of a president's term has had a different average personality. The midterm year, year two, has the worst reputation.
| Measure (S&P 500, since about 1950) | What history shows |
|---|---|
| Average peak-to-trough drop in midterm years | about 17-18% |
| Average peak-to-trough drop in other years | about 11-13% |
| 12 months after the midterm election | positive every time since the early 1950s |
| Average 12-month gain after the midterm | about 15-17%, depending on method |
| Average gain from the midterm-year low over the next 12 months | about 30% |
Sources: BNY Investments, Yardeni Research via CNBC, Oxford Economics via Reuters, LPL Research, Baird. Figures differ slightly by start year and method.
Two things stand out. Midterm years tend to bring a larger dip, and the year after the vote has a remarkable track record.
Why the pattern happens
Nobody can prove the cause, but three explanations come up again and again.
1. Uncertainty peaks before the vote. Businesses don't know which party will control Congress, so they hold back on hiring and investment decisions. Investors demand a bigger discount for the unknown. Once results are in, the fog lifts.
2. Presidents front-load hard decisions. New administrations tend to push tougher policies, such as tariffs, tax increases or spending cuts, in their first two years and save crowd-pleasers for the run-up to their own re-election.
3. Gridlock can calm markets. The president's party has lost House seats in most midterms. Divided government makes sweeping change less likely. Fewer surprises means less risk for companies.
Does 2026 fit the pattern?
So far, partly. The S&P 500 has been volatile. Oil above $100 a barrel, US inflation at 3.7%, the Fed's first rate hike in three years and a sharp AI selloff in mid-October have all hit markets. Polls suggest the president's party may struggle to hold its majorities, and voters cite higher prices.
Political moves are also hitting specific sectors. Two weeks before the vote, the president paused a major Russia sanctions package after a deal to buy Russian diesel, with fuel prices high on voters' minds.
But some analysts argue history may not repeat this time. Valuations are high, borrowing costs are the highest in two decades, and a recession would trump any election effect. A 70-year streak is impressive, but it's still only about 18 data points.
Sectors that tend to react
| Sector | Why it's sensitive to politics |
|---|---|
| Healthcare and pharma | Drug pricing rules, insurance subsidies |
| Energy | Drilling permits, sanctions, climate rules |
| Defence | Military budgets and foreign policy |
| Financials | Bank regulation and capital rules |
| Clean energy | Tax credits and subsidies |
| Trade-exposed companies | Tariffs and trade deals |
If you own a broad index fund, you own all of these, so a win for one party in one sector is usually offset somewhere else.
What investors should do
1. Don't try to time the election
To profit from timing, you'd have to sell at the right moment and buy back at the right moment. Some of the market's best days come right after its worst ones, and missing them can cut long-term returns sharply. See our guide on the real cost of doing nothing vs reacting.
2. Keep investing on schedule
If you buy every month, the dip that often comes in a midterm year means you buy more shares at lower prices. That's how dollar-cost averaging works in your favour.
3. Check your risk, not the polls
If a political swing would make you panic-sell, your portfolio may be too aggressive for your comfort. The fix is your asset mix, not a prediction about who wins.
4. Stop refreshing
Election nights come with wild futures moves that often reverse by morning. It's one more reason to stop checking your portfolio every hour.
A quick history lesson
Big market moves around midterms are usually driven by the economy, not the ballot box:
- 2022: The S&P 500 fell about 25% from its peak during the year, mostly due to inflation and Fed hikes. It rose strongly in the following 12 months.
- 2018: A sharp fourth-quarter selloff came after the vote, driven by Fed hikes and trade fears. Stocks still ended the next 12 months higher.
- 2002: A bear market from the dot-com bust bottomed in October, just before the vote.
In each case the bigger story was rates, earnings and the economy. Elections added noise.
The bottom line
Midterm years have historically been rougher than average for stocks, and the year after has historically been better than average. That's a useful reason to stay calm, not a trading strategy. Keep your plan, keep investing, and let the votes be counted.
This article is educational and not personalized investment advice. Historical patterns do not guarantee future results.
Frequently asked questions
When are the 2026 midterm elections?
The 2026 US midterm elections are on Tuesday, November 3, 2026. All 435 seats in the House of Representatives and about a third of the Senate are up for election, along with many governors and state legislatures.
Do stocks go down before midterm elections?
Often, yes. Since 1950 the S&P 500 has averaged a peak-to-trough decline of about 17% during midterm years, the deepest of the four years in the presidential cycle, with weakness often peaking around late summer or early fall. That doesn't mean every midterm year is negative, and the timing varies a lot.
What happens to stocks after midterm elections?
Historically the S&P 500 has been higher 12 months after every midterm election since the early 1950s, with average gains in the mid-teens, around 15% to 17% depending on the start date and method. Measured from the midterm-year low, the average 12-month rebound has been around 30%.
Is it better for stocks if Congress is divided?
Markets have often done well under divided government, partly because it makes sweeping policy changes less likely, which reduces uncertainty for businesses. But studies show strong returns under many different combinations of party control. The economy, interest rates and earnings matter far more than which party wins.
Should I sell my stocks before the election?
For most long-term investors, no. Selling means you have to be right twice, about when to get out and when to get back in, and missing a handful of the market's best days can significantly cut long-term returns. If election swings make you anxious, it's a sign to review whether your mix of stocks, bonds and cash fits your goals.
Which sectors are most affected by midterm elections?
Sectors most exposed to government policy tend to move most: healthcare (drug pricing), energy (drilling and climate rules), defence (budgets), financials (regulation) and clean energy (subsidies). Broad index funds spread that risk across all sectors.
Why are midterm years bad for stocks?
There are a few theories. Uncertainty about which party will control Congress makes businesses and investors cautious. Presidents also tend to push unpopular or difficult policies early in their terms and save market-friendly measures for later. After the vote, the uncertainty clears and the market typically rallies.
Primary sources
- BNY Investments — How do midterm elections impact markets over time?
- CNBC — Stocks usually climb in the year after midterms (Nov. 8, 2022)
- IBTimes / Reuters — Recession fears threaten perfect track record of post-midterm US stock gains
- Nasdaq / The Motley Fool — Why history isn't on the side of the S&P 500 heading into these next 10 months of 2026
- US House of Representatives — Elections, history and the midterm calendar
Data & disclaimer: This article is for educational purposes only and is not financial or investment advice. Figures reflect data available as of Oct 20, 2026, and conditions change — always confirm current pricing, rates and rules with the provider before you act. Written by Elizabeta Dimoska. See our editorial standards and disclosure.
Comments