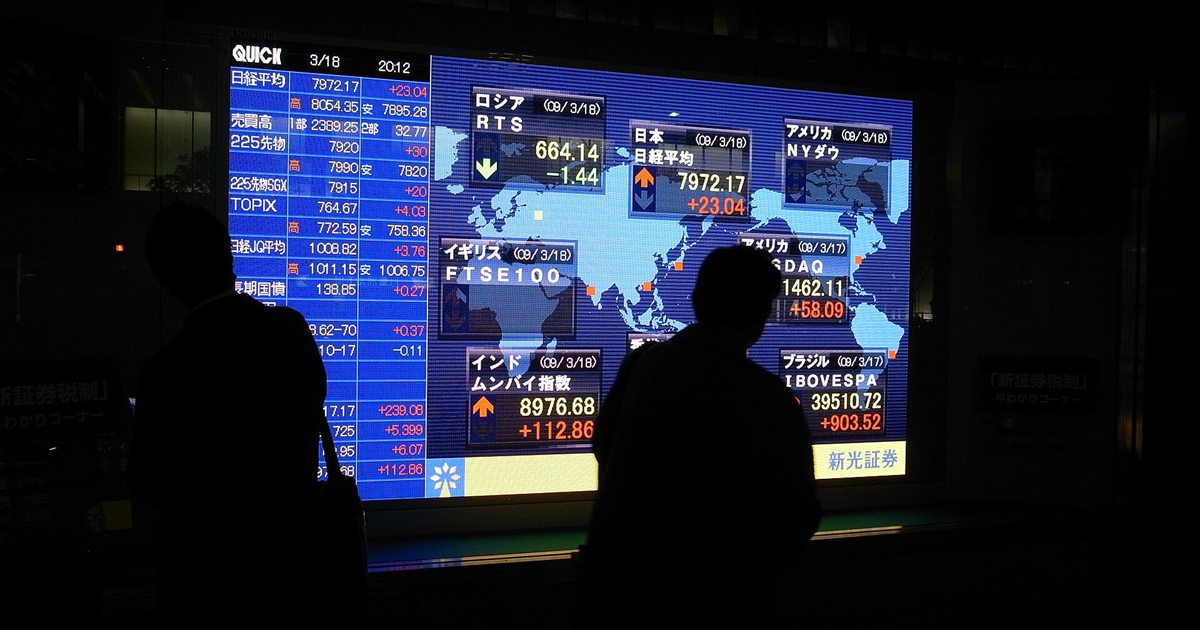
Photo: Kondo Atsushi / Wikimedia Commons, CC BY-SA 2.0, cropped
Best Free Stock Screeners in 2026: 7 Tools Ranked, Plus 3 Ready-Made Screens to Find Good Stocks
The best free stock screener for most people is Finviz: it's fast, needs no account, and lets you filter US stocks by dozens of measures such as P/E, revenue growth, dividend yield and debt. TradingView is best for chart-based screening and covers Canadian (TSX) and global stocks. Stock Analysis has the deepest free fundamental data, Koyfin the best dashboards, and Yahoo Finance the simplest screener for beginners. Free tiers usually show delayed data and limit saved screens, which is fine for long-term investors. A screener only builds a shortlist: always check each result with a proper research checklist before buying.
What a stock screener does
There are roughly 6,000 stocks listed in the US and well over 1,500 on the Toronto Stock Exchange. No one can research them all.
A stock screener lets you set rules such as "profitable, growing more than 10% a year, with low debt" and instantly filters the market down to a shortlist. It's step one of picking stocks. Step two is researching each result properly with a checklist like our 7-step stock-picking guide.
How we ranked them
We focused on what beginners and long-term investors need:
- Free tier quality. What you get without paying.
- Ease of use. Can a beginner build a screen in five minutes?
- Fundamental filters. Growth, profit, debt, valuation, dividends.
- Coverage. US only, or Canadian and global stocks too.
- Limits. Delayed data, saved screens, export.
Features were checked in October 2026. Free tiers change, so check the site.
Quick picks
| If you want... | Use |
|---|---|
| The fastest US screener, no sign-up | Finviz |
| Canadian (TSX) and global stocks, plus charts | TradingView |
| The deepest free financial data | Stock Analysis |
| Professional-style dashboards | Koyfin |
| The simplest start | Yahoo Finance |
| Earnings-revision rankings | Zacks |
| Everything in one place with your broker | Your broker's screener |
The comparison
| Screener | Account needed? | Coverage | Strength | Free-tier limits |
|---|---|---|---|---|
| Finviz | No | US stocks | Speed, filters, heat maps | Delayed data, ads |
| TradingView | Optional | US, Canada, global | Technical filters, charts | Fewer indicators, ads |
| Stock Analysis | No | US and global | Deep fundamentals, clean design | Can't save screens on free tier |
| Koyfin | Yes (free) | US, Canada, global | Dashboards, fundamentals | Limited screens and history |
| Yahoo Finance | Yes (free) | US and global, plus ETFs and funds | Simplicity | Fewer filters, delayed data |
| Zacks | No for basic | US stocks | Zacks Rank (earnings revisions) | Best screens are paid |
| Broker screeners | Brokerage account | Varies | Free, integrated | Varies by broker |
1. Finviz: best overall
Finviz is the screener most investors try first, and many never leave.
- No account needed. Open the page and start filtering.
- Dozens of filters across three tabs: descriptive (sector, market cap, country), fundamental (P/E, growth, margins, debt, dividends) and technical (price trends, moving averages).
- Heat maps that show the whole market at a glance.
Limits: data is delayed on the free version, there are ads, and coverage is mostly US-listed stocks. The paid Elite tier adds real-time data, backtesting and alerts.
Best for: quickly building a US stock shortlist.
2. TradingView: best for charts and Canadian stocks
TradingView started as a charting site and its screener reflects that, with strong technical filters. Crucially for Canadians, it covers TSX stocks and markets worldwide.
- Clean, beginner-friendly interface.
- Click any result to open a full, interactive chart.
- Fundamental filters are available, though the data is lighter than specialist tools.
Limits: the free tier restricts indicators and shows ads.
Best for: Canadian investors and anyone who wants to combine charts with screening. New to charts? Start with how to read a stock chart.
3. Stock Analysis: best free fundamentals
Stock Analysis offers years of income statements, balance sheets and cash-flow data for free, in a clean layout. Its screener filters on detailed fundamentals and covers many global markets.
Limits: you can't save screens on the free plan.
Best for: investors who want to dig into the numbers.
4. Koyfin: best dashboards
Koyfin looks like a professional terminal. The free plan includes a screener, fundamentals, charts and customizable dashboards, with coverage of US, Canadian and global stocks and ETFs.
Limits: free accounts have caps on screens, watchlists and data history.
Best for: investors who want a "Bloomberg-lite" experience without paying.
5. Yahoo Finance: simplest for beginners
Yahoo Finance's screener is basic, but that's its appeal. Pick a region, sector, market size and a few measures, and you're done. It also screens ETFs and mutual funds.
Limits: fewer filters than Finviz or TradingView, and delayed data.
Best for: your very first screen.
6. Zacks: best for earnings momentum
Zacks is known for the Zacks Rank, a 1-to-5 rating based on whether analysts are raising or cutting their earnings forecasts. The rank appears free on every stock page.
Limits: the screens that use the rank well require Zacks Premium.
Best for: investors interested in earnings-revision strategies.
7. Your broker's screener
Fidelity, Schwab, Interactive Brokers, Questrade and other brokers include free screeners with your account. They're integrated with your trading screen and often include analyst research. They're worth trying before signing up for anything else. See the best brokers for beginners and in Canada.
3 ready-made screens you can copy
Plug these settings into Finviz, TradingView or Stock Analysis.
Screen 1: Quality growth companies
| Filter | Setting |
|---|---|
| Market cap | Above $2 billion |
| Revenue growth (5 years) | Above 10% a year |
| Net profit margin | Above 10% |
| Return on equity | Above 15% |
| Debt-to-equity | Below 1 |
Finds: established, profitable companies that are growing with manageable debt.
Screen 2: Dividend payers with room to grow
| Filter | Setting |
|---|---|
| Market cap | Above $2 billion |
| Dividend yield | 2% to 6% |
| Payout ratio | Below 70% |
| Dividend growth (5 years) | Positive |
| Debt-to-equity | Below 1.5 |
Finds: companies paying sustainable, growing dividends. The yield cap of 6% filters out many "yield traps," where a high yield signals trouble. Learn more in dividend yield vs dividend growth.
Screen 3: Reasonably priced value stocks
| Filter | Setting |
|---|---|
| Market cap | Above $1 billion |
| P/E ratio | Below 15 |
| PEG ratio | Below 1.5 |
| Free cash flow | Positive |
| Current ratio | Above 1 |
Finds: companies trading at modest prices that still generate cash. Some will be cheap for good reason, which is why step two matters. See the P/E ratio explained.
Screener mistakes to avoid
- Treating results as buy signals. A screener finds candidates, not winners.
- Using too many filters. Ten filters can leave you with zero results or only oddballs. Start with four or five.
- Ignoring the industry. A P/E of 25 is high for a bank and low for a software company. Compare within sectors.
- Trusting one year of data. One great year can be a fluke. Use five-year figures where you can.
- Forgetting diversification. If every result is in one sector, your portfolio will be too.
The bottom line
Start with Finviz for US stocks or TradingView for Canadian ones. Use one of the three screens above to build a shortlist of 10 to 20 companies, then research each one with our 7-step stock-picking checklist. The screener saves you hours; the checklist saves you money.
Frequently asked questions
What is the best free stock screener?
For most investors, Finviz. It is fast, free without an account and offers dozens of fundamental and technical filters for US stocks. TradingView is better for Canadian and international stocks and chart-based screening, and Stock Analysis offers the deepest free fundamental data.
What is a stock screener?
A stock screener is a tool that filters thousands of stocks down to a shortlist that meets the criteria you choose, such as market size, P/E ratio, revenue growth, dividend yield or debt level. It is the first step in finding stocks to research, not a buy signal.
Which stock screener works for Canadian stocks?
TradingView's free screener covers TSX-listed stocks, as do Stock Analysis, Koyfin and Yahoo Finance to varying degrees. Finviz focuses on US-listed stocks, although some large Canadian companies with US listings appear there.
Are free stock screeners good enough?
Yes, for long-term investors. Free tiers usually have delayed prices, fewer saved screens and limited history, but those limits matter mainly to active traders. Paid tiers add real-time data, backtesting and alerts.
What are good stock screener settings for beginners?
A simple quality screen: market value above $2 billion, revenue growth above 5% a year, positive profit margin, debt-to-equity below 1 and P/E below 30. It filters out tiny, unprofitable and heavily indebted companies and leaves a manageable list to research.
Primary sources
Data & disclaimer: This article is for educational purposes only and is not financial or investment advice. Figures reflect data available as of Oct 14, 2026, and conditions change — always confirm current pricing, rates and rules with the provider before you act. Written by Elizabeta Dimoska. See our editorial standards and disclosure.
Comments